One of my first GIS Projects was related to understanding settlement patterns in Northern Uganda post-conflict. As part of that work, we looked into ways to see how the population has changed over time. We ended up doing a manual classification of huts by looking at imagery– but one other method that stood out was looking at light data. We couldn’t get fine enough resolution for our project.
I recently saw on the esri instagram page (@esrigram) about a new dataset of “lights at night” called “Black Marble Nighttime Blue/Yellow Composite (VIIRS / Suomi-NPP)” The resolution still isn’t amazing, it is 750 m per pixel. But this can tell some really interesting stories. The data is useful for identifying and monitoring changes in nighttime lights from cities, fires, boats, and other phenomena.
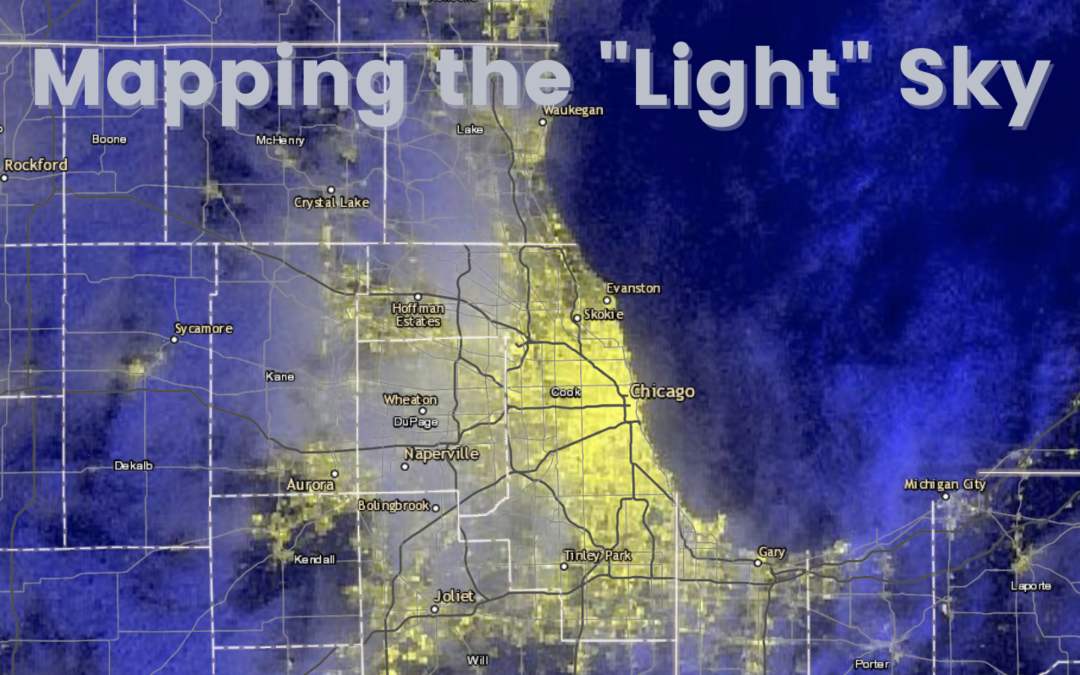
As I looked at Northern Illinois I added in some contextual layers (roads and place names) in addition to the lights at night so I could get a better understanding of the more densely populated areas in my community. Obviously, in some parts of the world, this proxy of “brightness” and population are not necessarily the same.
I found it interesting how concentrated the development was on the east side (by the lake). Census geographies (block groups/ tracts/ zip codes) are what are known as “areal” geographies. That means that they are essentially made up. Using something like the lights at night was helpful for me to understand some of the nuances of population density that can get lost when looking at aggregated densities.
Below you’ll see a screenshot where I pulled in population density from 2020 population estimates at the zip code level along with the lights at night. The lighter areas have less population, while the darker areas have more. IF we look at the zip code where Antioch is located we see that it has a low population density, but there is also a decent amount of “light”. That is because there is concentrated downtown and then more rural areas.

You can take a look at the map here. I’d love to know what applications you see for this data! Let me know!